
Resolution
1000 m
1 record(s)
Type of resources
Available actions
Topics
Keywords
Contact for the resource
Provided by
Formats
Representation types
Update frequencies
Status
Resolution
panaceaKeywords
GEMET keywords
From
1
-
1
/
1
-
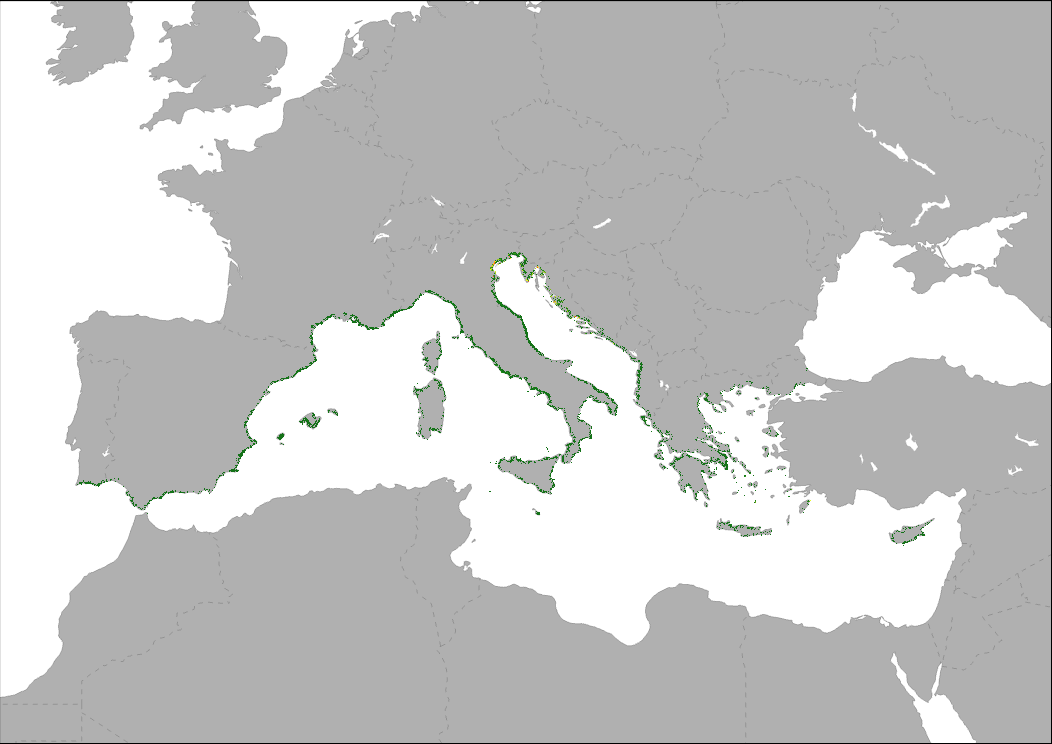
Map representing the number of establishments per km2, as an indicator of the local intensity of tourism capacity. This pressure index is based on Eurostat tourism statistic on number of tourism accommodation establishments and the DMSP-OLS Nighttime Lights Time Series image. Eurostat's tourism capacity statistics differentiate between coastal and non-coastal areas within a NUTS2 region. The total number of establishments in coastal areas of a NUTS2 region was disaggregated to the most intense nighttime light emission pixels of the Nighttime Lights Time Series assuming that most bed places are located in areas with high nighttime light emissions. Results are showing low to high intensive tourism capacity per km2 pixel.